
Shopify, for the UK
Shopify Statistics UK 2026
The Shopify statistics that pass a provenance check in 2026, plus our page-one Google study for UK sellers: 270 results analysed on 24 September 2026.
The short answer: there is no single set of Shopify statistics, only measurements taken by different people for different purposes. The rule on this page is provenance before magnitude: quote a figure only when its source, its date and what it actually counts travel with it. For our own study, we analysed page-one Google results for 28 UK queries on 24 September 2026: 270 results, of which 258 pages could be fetched and measured. The most striking finding is that 60% of those pages displayed prices, yet only 24% showed any visible date. On the company side, Shopify Inc.'s FY2025 results put gross merchandise volume at about $378bn, a company statement. Third-party trackers count anywhere between 3.06m and 7m live Shopify sites, because they define "live" differently. Shopify publishes no UK-only GMV or merchant count at all.
Most people landing here are writing something that other people will act on: a business plan, a pitch deck, a budget. A number without a source and a date is not evidence, it is decoration. This page exists so you can quote the dated figures and bin the rest.
If you are budgeting for a new shop rather than quoting figures, our guide to setting up a Shopify shop in the UK covers the pounds-and-pence side properly.
A note on money: this page uses Shopify affiliate links. If you sign up through one, we are paid a commission. You pay exactly the same as you would otherwise.
What ranks on Google for shopify statistics: our page-one study
This is our own count, not anybody's press release. We pulled the page one for 28 UK queries on 24 September 2026 and measured every result we could fetch.
- 270 — page-one results analysed across 28 UK queries (n = 270, fetched 24 September 2026).
- 258 — pages successfully fetched and measured; 12 blocked fetches were excluded from page-level rates (n = 258).
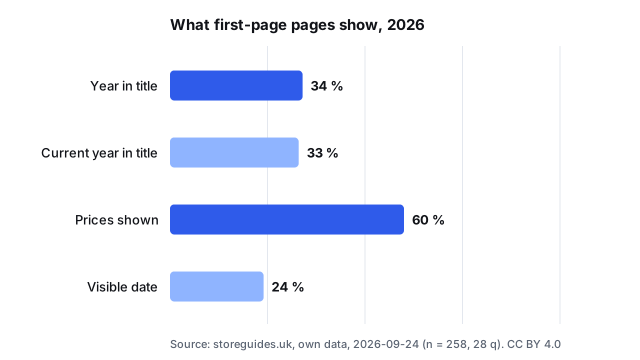
- 34% — of titles carried a year, and 33% carried the current year (n = 270).
- 60% — of pages displayed prices, against only 24% showing a visible publication date (n = 270).
- 2,037 — median word count, with a quarter of pages under 1,007 words and a quarter over 3,223 (n = 258).
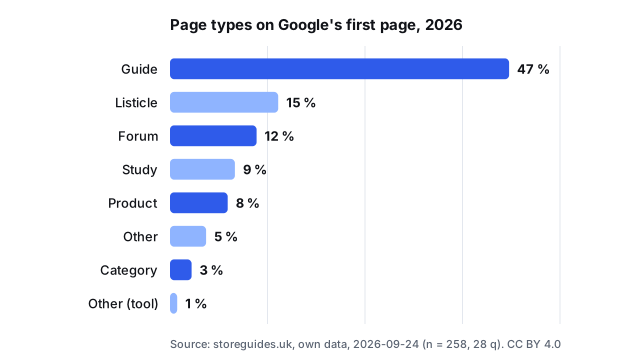
- 47% — of results were guides, 15% listicles and 12% forum threads (n = 270).
- 37 — page-one slots held by shopify.com, ahead of reddit.com on 19 and help.shopify.com on 18 (n = 270, 120 distinct domains).
The pattern holds query by query. Year-stamped queries attract year-stamped titles, and cost queries attract prices.
| Query | Year in title | Prices shown | Median words | Top page type |
|---|---|---|---|---|
| shopify statistics 2026 | 100% | 80% | 2,479 | listicle |
| shopify statistics | 80% | 70% | 2,409 | listicle |
| how many shopify stores are there | 60% | 78% | 2,272 | study |
| shopify cost per month uk | 60% | 100% | 3,401 | guide |
| online shopping statistics UK | 30% | 33% | 2,769 | study |
| shopify apps cost uk | 20% | 80% | 2,435 | guide |
Our take: the page one for this term is long, price-heavy and lightly dated. A page that shows prices but no date is asking you to trust figures it will not pin down. Only 9% of the results we classified were actual studies, and we would rather sit in that minority with dated numbers than in the majority without.
Shopify statistics: company figures against tracker counts
Two families of sources dominate this topic, and they answer different questions. Shopify Inc. reports its own results to shareholders; trackers crawl the web and estimate. Both can be correct at once, because they measure different things with different definitions.
| Figure as published | Who published it | Date checked | What it counts | Safe to quote for |
|---|---|---|---|---|
| Full-year 2025 revenue growth of 30% | Shopify Inc. results (company statement) | FY2025 | the company's own growth rate | the platform's trajectory, not a UK split |
| GMV about $378bn, FY2025 | Shopify Inc. results | FY2025 | order value processed across all shops | global scale, never UK demand |
| 3.06m to 7m live sites | third-party trackers, varying | varies by tracker | "live" defined differently each time | order of magnitude only |
| Roughly 10–12% of global ecommerce | tracker estimates | varies | share of online sales value | rough context, with the range shown |
| Basic plan £25 a month billed monthly | Shopify's UK pricing page, checked on 6 August 2026 | 6 August 2026 | the advertised plan price, before card fees and apps | budgeting the platform fee |
Now the gaps, because a UK reader wants three numbers nobody publishes. What share of UK ecommerce does Shopify hold? Not published; the nearest dated anchor is the Office for National Statistics' online share of retail, below. What is the average annual revenue of a UK Shopify shop? No published figure exists, so anyone quoting one is estimating. How fast is the UK store count growing? Also unpublished.
Our suggested working rule: treat every UK-specific Shopify number you meet as an estimate until it shows a source. For what a shop actually costs in pounds, see what Shopify costs per month in the UK, and for the tax side, VAT on a Shopify shop. The fuller picture is in our UK setup guide.
Verified UK and checkout figures worth quoting
These pass the provenance test: named source, date, published definition. Use them where they settle a decision, such as whether UK online demand justifies the budget in the first place.
- 0.5% — rise in UK retail sales volumes in August 2026, after a 0.5% fall in July (Office for National Statistics, 2026).
- 2.4% — year-on-year rise in retail sales volumes, August 2026 against August 2025 (the same ONS bulletin, 2026).
- 28.8% — proportion of UK retail sales made online in August 2026, up from 28.4% in July (the same ONS bulletin, 2026).
- 10.1% — rise in online spending values in the three months to August 2026, year on year (the same ONS bulletin, 2026).
- No. 1 — Shopify's position in the US e-commerce software market by share of websites using e-commerce technologies, as of August 2026 (Statista, 2026).
- 70.19% — global average cart abandonment rate, a running average (Baymard Institute, undated).
Note what the ONS figures do and do not say. They measure UK retail demand, not Shopify's slice of it. Pairing them with a platform claim is how a number gets laundered.
How to check a Shopify figure before you quote it
Three checks, in order. If a figure fails any one of them, it does not go into your plan.
Our suggested three-check template — copy it into your notes:
- Named source: who measured this, and are they the platform, a tracker or a statistics office?
- As-of date: when was it measured, and has the underlying page changed since?
- UK definition: does it cover the UK, or is it global or US data wearing a UK headline?
The gold standard is a national statistics office. Across the Atlantic, the United States Census Bureau publishes a quarterly retail e-commerce report with its methods in the open, definitions first. That is the company a quotable figure keeps.
Then the drop-out line. Dated-once numbers (measured in 2021, quoted in 2026), laundered numbers (a tracker's estimate restated as fact) and reputation-only numbers ("trusted by millions of merchants") earn no place in your planning. Undated means marketing.
How we counted
Page-one results, 10 per query, for 28 UK queries, fetched on 24 September 2026 through our hub search layer: 270 results in total. Each page was classified by type and measured for word count, year in title, prices shown and visible date. Twelve blocked or unknown fetches were excluded from page-level rates, which is why some percentages use n = 258. Every figure in the first section is our own computation from that fetch. We do not re-measure other people's numbers; we cite them as published or leave them out.
Previous years
This is the first edition, published on 24 September 2026; next year's refresh will move these figures here and replace them with new ones.
Sources
- Office for National Statistics, Retail sales, Great Britain: August 2026 — checked on 24 September 2026.
- Statista, Market share of e-commerce software platforms in United States as of August 2026 — checked on 24 September 2026.
- Baymard Institute, Cart & Checkout Usability Research — checked on 24 September 2026.
- United States Census Bureau, Quarterly Retail E-Commerce Sales Report, 2nd Quarter 2026 — checked on 24 September 2026.
Download the data
The aggregates on this page are Store Guides UK's own data (never per-product prices or third-party text). Each file carries the snapshot date, the sample size and the method.
Licence CC BY 4.0: you may reuse these figures and charts by crediting Store Guides UK with a link to this page.